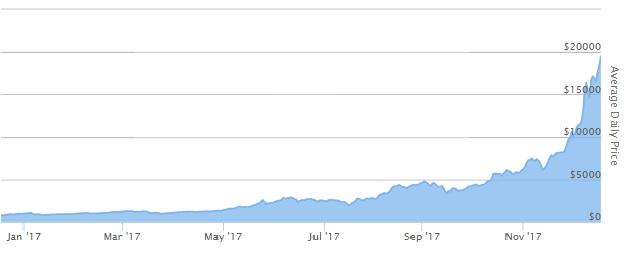
Over the last couple of days the infographic If Only You’d Invested in Bitcoin has been shared many times. And that is of course because the price of Bitcoin has gone crazy from approximately $1000 USD at the beginning of 2017 to just under $20,000 USD today. If you had invested about $100 in Bitcoin in 2010, you’d be as rich as Madonna! Pretty crazy, eh? But that got me thinking, it isn’t as simple as that. Bitcoin has had a turbulent history, and there have been numerous crashes since its inception in 2009. The amazing thing is that despite all of these crashes, Bitcoin is still here and not only that is as strong as ever!
1. Bitcoin Price Chart with Key Historic Events
Check out this brilliant interactive Bitcoin price chart that depicts the peaks and dips in the price of Bitcoin along with the major key events.
Bitcoin Price Chart
Source: 99bitcoins.com
2. If You’d Invested in Bitcoin
So, with that in mind now check out what a modest Bitcoin investment in 2010 would have got you. $50 would now be worth

3. But it Ain’t that Simple, eh?

Pingback: My Notes From The Satoshi Nakamoto Bitcoin WhitePaper
Pingback: What the Bank of England Really Thinks About Cryptocurrencies